This Statement of intent (SoI) sets out an approach and course of action for the next three years that will contribute to the delivery of the government's land transport objectives and wider transport vision. It includes performance measures and what is intended to be measured (and how) and details of what is expected to be accomplished. The document also includes full financial statements. The SoI is a statutory compliance document.
Download the complete report:
NZ Transport Agency Statement of intent 2013–2016 [PDF, 1.5 MB]

| Previous page | Table of contents | Next page |
1. We are committed to making it easier for significantly more people to transact with us online. Our contribution to the government’s Better Public Services Result Area 10 (for 70% of vehicle licences to be renewed online by 2017) is ambitious and requires a step change in how we deliver online services for customers.
2. We need to better understand our customers’ attitudes, needs and behaviours if we are to successfully deliver our goals. For example, understanding and responding to peoples’ experiences of congestion, supply chains and access to employment and markets will help us invest where it matters most.
3. We require a joined-up view of our customers in order to deliver effective and efficient services.
4. Our aim is to move from an organisation that offers a set of discrete services to customers to offering a complete package of transport solutions.
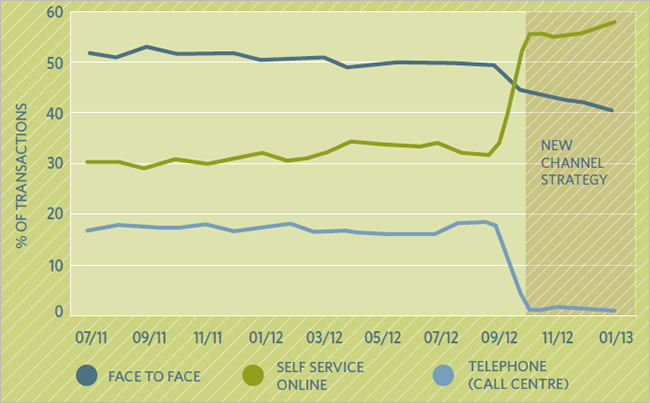
We aim to deliver services where our customers are, using the channels they use. We also aim to be responsive to customers, recognising the power of positive influence in shaping behaviour. Our channel shift approach is proving effective in achieving these objectives, demonstrated here by our Twitter presence and new channel strategy.
| A Twitter conversation |
|---|

'Also, NZTA, my address exists. I have received mail to it, but I can't register my car to it?!' @nzta_news: 'We may be able to help you with this. Please call us on 0800 108 809.' |
| Key results by 2016 | Milestones by 2013/14 |
|---|---|
| We better understand customer preferences for service provision and are adapting our business models to reflect this | Customer capability training rolled out across the NZTA |
| Every NZTA team identifies and uses customer feedback as a fundamental feature of how they operate | Customer insight techniques are being applied in all relevant business improvement projects |
| More services are available through digital channels | Work programme underway to make it easier for customers to transact online |
Average Gallup score for staff who identify their team uses feedback from customers to improve our services:
Desired trend: Increasing
| Twitter feedback |
|---|
|
'Well, Twitter bots work out! NZTA found me, contacted me and sorted the whole thing out manually over the phone. Kudos where it's due.' |
@nzta_news statistics
1. Better use of existing transport capacity is a key aim in the 2012 Government Policy Statement on Land Transport Funding.
2. We also need to continue to build on the momentum of the roads of national significance and public transport improvements.
3. Current initiatives around traffic operations centres, network optimisation plans and the implementation of the public transport operating model should be brought together as an integrated package to enhance transport efficiency and lower the cost of transportation.
We increasingly monitor and manage urban networks through joint traffic operations centres (in Auckland, Wellington and Christchurch). We do this to ensure traffic flows smoothly and any incidents are resolved as quickly as possible. Such activities form part of our broader programme to make the most of our urban network capacity.
| Key results by 2016 | Milestones by 2013/14 |
|---|---|
| Network operating plans have been completed for all major urban centres and are being implemented to achieve measurable benefits (Note: this is a shared desired result with these local authorities) |
Network operating plans completed in Auckland, Wellington and Christchurch (including public transport) |
| Transport operations centres in Auckland, Wellington and Christchurch are consolidated and working efficiently (Note: this is a shared desired result with these local authorities) |
Christchurch Transport Operating Centre is fully operational Wellington Transport Operating Centre is operational between Wellington City Council and the NZTA , with all councils committed to join |
| Urban public transport makes a greater contribution to network performance by implementing the public transport reviews that differentiate levels of service and reprioritise public transport resources and investment to where it has greatest impact (Note: this is a shared desired result with regional councils, public transport operators and territorial local authorities) |
Through the implementation of the public transport operating model, public transport activities in Auckland, Wellington and Christchurch are being refocused so that they are making a measurable contribution to improved network capacity utilisation Develop business case for Christchurch transport interchange and key hubs/spokes (Note: shared result with CERA, ECAN and CCC) |
Network productivity (vehicle speed and flow on urban networks in Auckland):
Value add of achieving target: $60 million in social and operating cost savings by 30 June 2016
Great North Road - daily flow profile
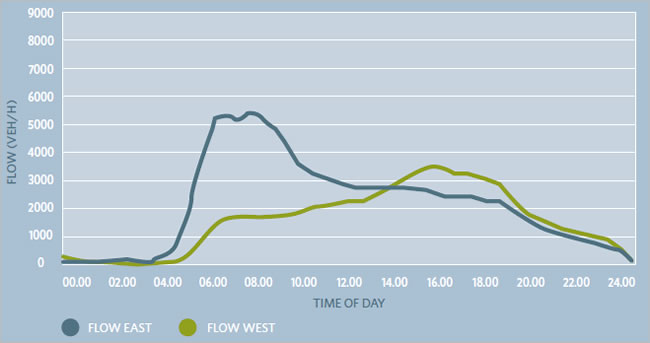
Newmarket Viaduct - daily flow profile

St Mary's Bay - daily flow profile

Central Motorway Junction - daily flow profile

1. The government’s objective is to lift transport sector productivity to enhance our export trade and New Zealand’s economic growth, and the accelerated uptake of high productivity motor vehicles (HPMVs) was highlighted as a priority in the Productivity Commission’s International Freight Transport Services Inquiry.
2. Analysis shows that a national HPMV network could also substantially reduce costs, with an estimated 20% decrease in truck trips using over-mass permits and a 14% decrease in overdimension permits.
3. Increasing HPMV use is therefore a key priority for the freight sector (identified as one of seven critical issues that would reduce the cost of doing business in New Zealand in the upper North Island freight story).
4. Additionally there are significant safety benefits from reducing the number of truck trips on our roads, while still moving the same amount of freight.
5. Freight forecasts are predicting a 100% growth in the volume of freight moved by 2040. To move this increase in freight will either require more trucks and truck trips or the alternative is to move more freight on every truck trip where this is feasible.
Moving more freight with fewer truck trips has economic, safety and environmental benefits. High productivity motor vehicles (HPMVs) can achieve these gains because they are between 14% (for longer loads) and 20% (for heavier loads) more efficient. Increasing the use of HPMV s will continue alongside our broader work to improve freight supply chain efficiency.
| Key results by 2016 | Milestones by 2013/14 |
|---|---|
| Enhanced HPMV strategic route availability, including ‘first–last mile’ access on local roads and 50MAX HPMV access (trucks up to 50 tonnes), delivers tangible productivity gains for operators (Note: this is a shared desired result with local authorities) |
Deliver access to 1500 kilometres on the strategic HPMV freight network 50MAX HPMV network available on 50% of road network |
| All HPMV permits for approved routes are processed within five working days (Note: this is a shared desired result with local authorities) |
All HPMV permits for state highways are approved within five working days |
| Smarter, more comprehensive, enforcement of illegally overloaded trucks encourages operator uptake of HPMV permits (Note: this is a shared desired result with NZ Police) |
Weigh Right Action Plan completed and agreed with key parties involved |
Percentage of travel by high productivity motor vehicle (HPMV ) as a total of heavy vehicle kilometres travelled:
Value add of achieving target: $150-195 million cost savings to freight sector by 30 June 2016

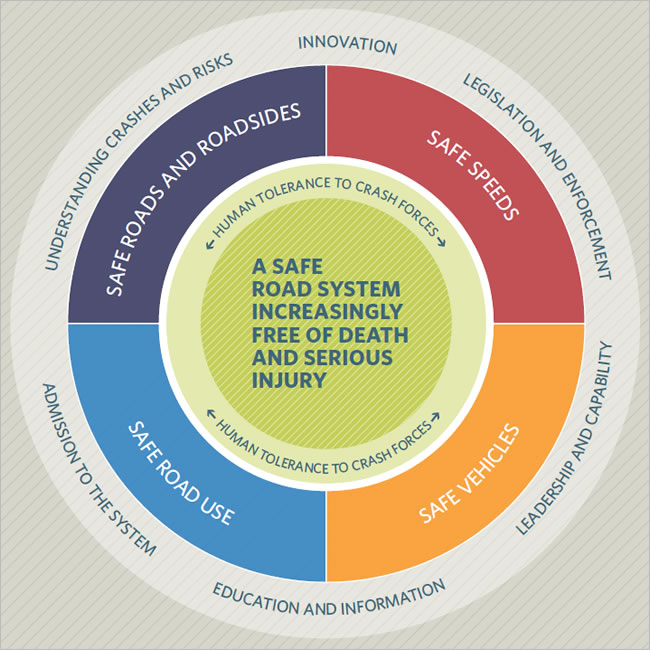
1. Strategic direction from the government confirms the need to achieve safe speeds. Safer Journeys: New Zealand’s road safety strategy to 2020 adopts the Safe System approach. Safe speeds is at the heart of a safe road system because speed is the energy in the system – if we manage that well, crashes become survivable. Impact speed plays a big part in our high road toll. Even when speed doesn’t contribute to a crash occurring, it always influences whether people walk away or are carried away. The Safer Journeys 2013–15 Action Plan focuses on four strategic actions that are intended to be transformational and ambitious, ensuring safe speeds is one of those.
2. Small changes in speeds make a big difference – a 1% reduction in mean open road speeds delivers a 4% reduction in fatalities. Such a reduction in average open road speeds in 2012 would have meant eight more people alive today, and 32 fewer hospitalisations and ACC claims for serious injuries.
3. New Zealand’s speeds, speed limits and enforced tolerances are not well aligned with road design, our vehicle fleet or the environment. Diversity in speed limits across the country is increasing, creating challenges for drivers and riders.
4. This complex, multi-dimensional issue needs clear, sustained direction and leadership in order to make better progress. The NZTA, with its established sector and local government partnerships, is well placed to lead this with the Ministry of Transport.
People make mistakes
We need to recognise that people make mistakes and some crashes are inevitable.
People are vulnerable
Our bodies have a limited ability to withstand crash forces without being seriously injured or killed.
We need to share the responsibility
System designers and people who use the roads must all share responsibility for creating a road system where crash forces do not result in death or serious injury.
We need to strengthen all parts of the system
We need to improve the safety of all parts of the system – roads and roadsides, speeds, vehicles, and road use so that if one part fails, other parts will still protect the people involved.
| Key results by 2016 | Milestones by 2013/14 |
|---|---|
| The new national direction and guidance for speed management in New Zealand is widely supported and adopted by road controlling authorities and key agencies (Note: this is a shared desired result with the Ministry of Transport, NZ Police, local government, ACC and road user groups) |
Develop with road safety partners, a new national direction and guidance on speeds that are right for the road, the vehicle and the environment |
| The New Zealand public is more supportive of a safe system and safe speeds linked to different types of roads, vehicles and environments, as shown in a reduction in mean speeds on high volume undivided open roads (Note: this is a shared desired result with the Ministry of Transport, NZ Police, local government, ACC and road user groups) |
Develop a comprehensive, long-term communication and engagement programme to increase partner, stakeholder and public understanding of, and support for, safe speeds. This will have a strong education focus |
| The national and regional strategic high volume roads that require changes to enable safe speeds are incorporated in the 2015–18 and future NLTPs within the available funding, leading to a sustained increase in the percentage of national and regional strategic arterials and state highways with a star rating of 3.5 and above | Develop a speed risk management guide to inform speed interventions across all parts of the road safety system and link application of the guide to investment |
Number of deaths and serious injuries on open (80–100km/h) roads:
Value of achieving target: $650 million in social cost savings by 30 June 2016
1. Growth in the size of the network and the changing nature of the network (use of technology such as variable message signs) is putting pressure on maintenance spending and increasing the focus on managing the whole of life costs of the asset. Inflation and rising costs of key inputs (petroleum-based products) are creating additional cost pressures.
2. In a funding constrained environment, we need to pursue greater value for money through improving the efficiency of investment in roads.
3. In order to achieve this the Road Maintenance Task Force recommendations and the State Highways Maintenance and Operations review work identified the need to change existing business models.
4. The taskforce also identified the importance of service level differentiation and the need to prioritise investment and the adoption of advanced asset management practices in order to gain greater efficiencies and effectiveness of renewal, maintenance and operations expenditure.
The Road Efficiency Group (REG ) is a joint Local Government NZ and NZTA partnership which is implementing the recommendations of the Road Maintenance Task Force.
Cross sector teams have been set up to progress the initiatives which will be substantially finalised by the end of this year. The teams are focusing on:
The working teams will deliver learnings and best practice tools for road controlling authorities to utilise in the future. This will help local authorities and NZTA to plan, invest in, maintain and operate the road network in a more strategic, consistent and affordable way throughout the country.
| Key results by 2016 | Milestones by 2013/14 |
|---|---|
| All roads are differentiated by form and type to allow national consistency in investment priorities, in all work programmes in the NLTP | Develop a one network classification tool and determine associated levels of service Align the understanding of the one network classification system with RCA partners and its use in investment decisions Alignment on the investment process |
| Culture of collaboration and information sharing exists between all road controlling authorities (RCAs) | Conversations with and between all RCAs, and business cases for the 4–5 early adopters |
| Asset management plans developed and implemented consistently throughout New Zealand | Differences in asset management plans identified and remedial measures explored |
| Asset management planning and procurement policy and guidance is aligned to promote value for money | Streamlined procurement practices in place The long-term programme of investment is clarified |
Programmed savings in maintenance and operations activity in 2012–15 NLTP:
Desired trend: Increasing

| Previous page | Table of contents | Next page |