This Statement of intent (SoI) sets out an approach and course of action for the next three years that will contribute to the delivery of the government's land transport objectives and wider transport vision. It includes performance measures and what is intended to be measured (and how) and details of what is expected to be accomplished. The document also includes full financial statements. The SoI is a statutory compliance document.
Download the complete report:
NZ Transport Agency Statement of intent 2013–2016 [PDF, 1.5 MB]

| Previous page | Table of contents | Next page |
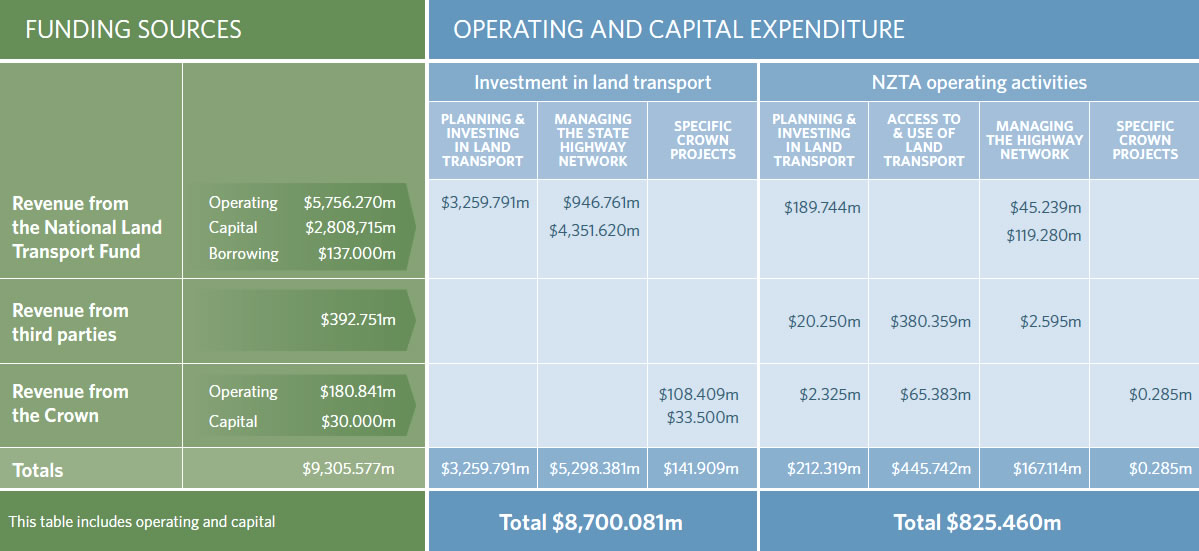
We have budgeted revenue of $9.3 billion for 2013-16 to fund:
 View larger version (JPG, 103 KB)
NZ Transport Agency group operating activities
This table shows the NZTA’s total expenditure from its operating activities.
| Projected 2012/13 $000 | Budget 2013/14 $000 | Forecast 2014/15 $000 | Forecast 2015/16 $000 | |
|---|---|---|---|---|
| Personnel costs | 108,610 | 117,170 | 120,332 | 123,262 |
| Operating expenses | 141,054 | 145,995 | 142,207 | 141,295 |
| Depreciation and amortisation expense | 8,180 | 9,666 | 13,084 | 12,449 |
| Total expenditure | 257,844 | 272,831 | 275,623 | 277,006 |
The budgeted increase in personnel costs is a mix of planned increases in remuneration and planned increases in staff numbers to bring inhouse some activities that were previously outsourced.
Managing our assets
Each year the NZTA prepares a capital programme to ensure that it has the infrastructure required to fulfil its functions. The budget set aside for the next three years, not including state highway network activities, is set out below.
| Projected 2012/13 $000 | Budget 2013/14 $000 | Forecast 2014/15 $000 | Forecast 2015/16 $000 | |
|---|---|---|---|---|
| Computer hardware | 2,750 | 2,000 | 2,000 | 2,000 |
| Computer software | 6,725 | 7,720 | 7,000 | 7,000 |
| Leasehold improvements | 1,000 | 500 | 3,300 | 1,400 |
| Furniture and fittings | 100 | 280 | 1,000 | 100 |
| Office, plant & equipment | 75 | 100 | 150 | 20 |
| Crash analysis system (transfer from MoT) | 408 | 0 | 0 | 0 |
| National integrated transport ticketing system | 2,582 | 200 | 1,000 | 0 |
| Total | 13,640 | 10,800 | 14,450 | 10,520 |
The focus of the capital programme is on upgrading our technology and making improvements to business critical systems and applications.
From an infrastructure perspective, the assets purchased primarily relate to the replacement of assets that have exceeded their useful life or in the case of computer equipment and furniture are part of a planned replacement programme.
Third party fees and charges funded activities
Memorandum accounts are notional accounts that record the accumulated balance of surpluses and deficits incurred for third party funded outputs operating on a full cost recovery basis.
| Third party fees and charges by funding source | ||||
|---|---|---|---|---|
| Projected 2012/13 $000 | Budget 2013/14 $000 | Forecast 2014/15 $000 | Forecast 2015/16 $000 | |
| Border inspections | ||||
| Net surplus/(deficit) | 1,124 | (60) | (100) | (100) |
| Balance at 30 June | 1,860 | 1,800 | 1,700 | 1,600 |
| Certification reviews | ||||
| Net surplus/(deficit) | (1,175) | (500) | 1,700 | 1,800 |
| Balance at 30 June | (3,100) | (3,600) | (1,900) | (100) |
| Driver licensing | ||||
| Net surplus/(deficit) | 2,721 | (800) | (700) | (100) |
| Balance at 30 June | 500 | (300) | (1,000) | (1,100) |
| Driver testing | ||||
| Net surplus/(deficit) | 1,986 | 0 | 400 | 400 |
| Balance at 30 June | 3,200 | 3,200 | 3,600 | 4,000 |
| Motor vehicle licensing | ||||
| Net surplus/(deficit) | 1,500 | 1,700 | (1,300) | (1,500) |
| Balance at 30 June | 1,500 | 3,200 | 1,900 | 400 |
| Overdimension permits | ||||
| Net surplus/(deficit) | (74) | (100) | (100) | (100) |
| Balance at 30 June | 500 | 400 | 300 | 200 |
| Rail licensing | ||||
| Net surplus/(deficit) | 139 | (300) | (100) | (100) |
| Balance at 30 June | (2,300) | (2,600) | (2,700) | (2,800) |
| Standards development and certification | ||||
| Net surplus/(deficit) | 1,626 | (300) | (1,800) | (1,800) |
| Balance at 30 June | 2,300 | 2,000 | 200 | (1,600) |
| Transport licensing | ||||
| Net surplus/(deficit) | (492) | (100) | 400 | 300 |
| Balance at 30 June | (3,700) | (3,800) | (3,400) | (3,100) |
| Total memo account – third party fees/charges | 760 | 300 | (1,300) | (2,500) |
All memorandum accounts areas are reviewed to ensure costs are aligned with fee revenue with the longer term aim of balancing each of these. Until these reviews are fully completed, some memorandum accounts will continue to carry negative balances.
Investment in land transport
The NZTA develops the three-year National Land Transport Programme (NLTP) based on the policy direction in the Land Transport Management Act and the Government Policy Statement on Land Transport Funding (GPS) and regional priorities. This table below shows the activity classes which are funded from the National Land Transport Programme and associated activities funded from the Crown. The investment in land transport is net of the expenditure on new and renewal of state highways which is capitalised and the NZTA operating expenditure which is separately shown in the statement of comprehensive income.
The three-year NLTP period covers 2012/13. The budget for each year depends on the portion of the programme that is delivered in the previous years. The investment in local roads and public transport is the NLTP contribution only and does not include the significant contribution from local authorities.
| Investment in land transport | ||||
|---|---|---|---|---|
| Projected 2012/13 $000 | Budget 2013/14 $000 | Forecast 2014/15 $000 | Forecast 2015/16 $000 | |
| New and improved infrastructure for state highways | 958,000 | 1,159,000 | 1,317,000 | 1,320,000 |
| Renewal of state highways | 187,900 | 222,000 | 227,000 | 225,900 |
| Maintenance and operation of state highways | 352,700 | 312,000 | 335,000 | 345,000 |
| New and improved infrastructure for local roads | 150,000 | 160,000 | 165,000 | 191,000 |
| Renewal of local roads | 212,000 | 246,000 | 246,000 | 262,500 |
| Maintenance and operation of local roads | 284,000 | 289,000 | 293,000 | 306,000 |
| Public transport | 299,000 | 316,000 | 310,000 | 342,800 |
| Road safety promotion | 30,800 | 32,100 | 31,900 | 33,700 |
| Walking and cycling | 12,000 | 20,000 | 20,000 | 20,600 |
| Sector research | 4,400 | 5,600 | 5,000 | 5,100 |
| Transport planning | 14,430 | 15,990 | 15,980 | 17,300 |
| Management of the funding allocation system | 29,000 | 30,000 | 30,000 | 30,600 |
| Interest on borrowings | 4,550 | 5,200 | 3,240 | 2,275 |
| Total NLTP expenditure | 2,538,780 | 2,812,890 | 2,999,120 | 3,102,775 |
| Activities funded on behalf of the Crown | ||||
| Enhanced PT concession for SuperGold cardholders | 22,755 | 23,905 | 25,905 | 17,905 |
| Administration of the SuperGold card scheme | 95 | 95 | 95 | 95 |
| Construction of passing opportunities on SH2 | 1,500 | 3,500 | 0 | 0 |
| National War Memorial Park | 20,000 | 20,000 | 10,000 | 0 |
| Reinstatement of local roads in Canterbury | 25,200 | 40,694 | 0 | 0 |
| Sub total of activities funded on behalf of the Crown | 69,550 | 88,194 | 36,000 | 18,000 |
| 2,608,330 | 2,901,084 | 3,035,120 | 3,120,775 | |
| Less capital expenditure | (1,167,400) | (1,404,500) | (1,554,000) | (1,545,900) |
| Less NZTA operating activities funded from the NLTP | (109,114) | (117,819) | (118,467) | (120,612) |
| Less interest on borrowing | (4,550) | (5,200) | (3,240) | (2,275) |
| Total investment in land transport | 1,327,266 | 1,373,565 | 1,359,413 | 1,451,988 |
The consolidated financial statements include the parent NZ Transport Agency and its subsidiary NZ Transport Ticketing Limited.
| Projected 2012/13 $000 | Budget 2013/14 $000 | Forecast 2014/15 $000 | Forecast 2015/16 $000 | |
|---|---|---|---|---|
| Income | ||||
| Revenue from the Crown | 64,172 | 91,242 | 48,829 | 40,770 |
| Revenue from the National Land Transport Fund | 1,823,457 | 1,864,290 | 1,892,880 | 1,999,100 |
| Revenue from third parties | 131,806 | 130,915 | 131,068 | 130,768 |
| Total income | 2,019,435 | 2,086,447 | 2,072,777 | 2,170,638 |
| Expenditure | ||||
| Personnel costs | 108,610 | 117,170 | 120,332 | 123,262 |
| Operating expenses | 141,054 | 145,995 | 142,207 | 141,295 |
| Investment in land transport | 1,327,266 | 1,373,565 | 1,359,413 | 1,451,988 |
| Interest on borrowing | 4,550 | 5,200 | 3,240 | 2,275 |
| Depreciation and amortisation expense | 420,360 | 426,666 | 435,084 | 439,449 |
| State highway asset write-off | 17,500 | 10,500 | 10,500 | 10,500 |
| Total expenditure | 2,019,340 | 2,079,096 | 2,070,776 | 2,168,769 |
| Net surplus/(deficit) | 95 | 7,351 | 2,001 | 1,869 |
| Other comprehensive income | ||||
| Gain/(loss) state highway network/Bailey bridging revaluations | 300,000 | 300,000 | 300,000 | 300,000 |
| Total other comprehensive income | 300,000 | 300,000 | 300,000 | 300,000 |
| Total comprehensive income for the year | 300,095 | 307,351 | 302,001 | 301,869 |
| Projected 2012/13 $000 | Budget 2013/14 $000 | Forecast 2014/15 $000 | Forecast 2015/16 $000 | |
|---|---|---|---|---|
| Assets | ||||
| Current assets | ||||
| Cash and cash equivalents | 50,000 | 50,050 | 50,050 | 50,050 |
| Debtor National Land Transport Fund | 424,488 | 398,168 | 454,521 | 409,480 |
| Debtor Crown | 21,924 | 31,173 | 16,682 | 13,929 |
| Debtors and other receivables | 26,000 | 26,279 | 26,475 | 26,475 |
| Property assets held for sale | 57,000 | 50,000 | 50,000 | 50,000 |
| Prepayments | 2,200 | 2,200 | 2,200 | 2,200 |
| Inventories | 581,812 | 558,070 | 600,128 | 552,334 |
| Total current assets | 581,812 | 558,070 | 600,128 | 552,334 |
| Non-current assets | ||||
| Property, plant and equipment | 18,308 | 15,743 | 16,218 | 14,325 |
| State highway network | 26,809,419 | 28,242,902 | 29,370,919 | 30,702,319 |
| Bailey bridging | 7,375 | 7,375 | 7,375 | 7,375 |
| Intangible assets | 43,417 | 47,116 | 48,007 | 47,971 |
| Loans and advances | 900 | 900 | 900 | 900 |
| Total non-current assets | 26,879,419 | 28,314,036 | 29,443,419 | 30,772,890 |
| Total assets | 27,461,231 | 28,872,106 | 30,043,547 | 31,325,224 |
| Liabilities | ||||
| Current liabilities | ||||
| Creditors and other payables | 346,579 | 281,287 | 223,478 | 226,612 |
| Tolling funds held in trust | 3,200 | 3,200 | 3,200 | |
| Employee entitlements | 12,000 | 12,015 | 12,025 | 12,025 |
| Borrowing | 100,000 | 250,000 | 110,000 | 60,000 |
| Total current liabilities | 461,779 | 546,502 | 348,703 | 301,837 |
| Non-current liabilities | ||||
| Creditors and other payables | 200 | 200 | 200 | 200 |
| Employee entitlements | 4,700 | 4,700 | 4,700 | 4,700 |
| Borrowing (for toll roads) | 0 | 120,000 | 137,000 | 137,000 |
| Total non-current liabilities | 4,900 | 124,900 | 141,900 | 141,900 |
| Total liabilities | 466,679 | 671,402 | 490,603 | 443,737 |
| Net assets | 26,994,552 | 28,200,703 | 29,552,944 | 30,881,488 |
| Equity | ||||
| General funds | 25,606 | 25,806 | 26,806 | 26,806 |
| Retained funds | 22,310 | 25,221 | 23,562 | 21,906 |
| Memorandum account – third party fees and charges | 760 | 300 | (1,300) | (2,500) |
| State highway network * | 26,945,876 | 28,149,376 | 29,503,876 | 30,835,276 |
| Total equity | 26,994,552 | 28,200,703 | 29,552,944 | 30,881,488 |
* The state highway network includes the state highway investment (including Bailey bridging) and revaluation reserves.
| Projected 2012/13 $000 | Budget 2013/14 $000 | Forecast 2014/15 $000 | Forecast 2015/16 $000 | |
|---|---|---|---|---|
| Equity – opening balances | ||||
| General funds | 5,198 | 25,606 | 25,806 | 26,806 |
| Retained funds | 47,885 | 22,310 | 25,221 | 23,562 |
| Memorandum account – third party fees and charges | (6,595) | 760 | 300 | (1,300) |
| State highway network | 25,974,656 | 26,945,876 | 28,149,376 | 29,503,876 |
| Total equity – opening balance | 26,021,144 | 26,994,552 | 28,200,703 | 29,552,944 |
| Changes in equity | ||||
| Comprehensive income | ||||
| Retained funds | (7,260) | 7,811 | 3,601 | 3,069 |
| Memorandum account – third party fees and charges | 7,355 | (460) | (1,600) | (1,200) |
| State highway network – gain/(loss) on revaluations | 300,000 | 300,000 | 300,000 | 300,000 |
| 300,095 | 307,351 | 302,001 | 301,869 | |
| Owner transactions | ||||
| Capital contribution – general funds | 20,408 | 200 | 1,000 | 0 |
| Capital contribution – National Land Transport Programme | 650,323 | 758,600 | 1,022,240 | 1,026,675 |
| Capital contribution – National War Memorial Park | 20,000 | 20,000 | 10,000 | 0 |
| Borrowing (for toll roads) | 0 | 120,000 | 17,000 | 0 |
| 690,731 | 898,800 | 1,050,240 | 1,026,675 | |
| Total changes in equity | 990,826 | 1,206,151 | 1,352,241 | 1,328,544 |
| Equity – closing balances | ||||
| General funds | 25,606 | 25,806 | 26,806 | 26,806 |
| Retained funds | 22,310 | 25,221 | 23,562 | 21,906 |
| Memorandum account – third party fees and charges | 760 | 300 | (1,300) | (2,500) |
| State highway network | 26,945,876 | 28,149,376 | 29,503,876 | 30,835,276 |
| Total equity – closing balances | 26,994,552 | 28,200,703 | 29,552,944 | 30,881,488 |
| Projected 2012/13 $000 | Budget 2013/14 $000 | Forecast 2014/15 $000 | Forecast 2015/16 $000 | |
|---|---|---|---|---|
| Cash flows from operating activities | ||||
| Receipts from Crown revenue | 90,813 | 81,994 | 63,319 | 43,523 |
| Receipts from National Land Transport Fund revenue | 1,806,422 | 2,010,610 | 1,853,527 | 2,044,141 |
| Receipts from third party revenue | 130,250 | 130,136 | 130,372 | 130,268 |
| Interest received | 1,562 | 500 | 500 | 500 |
| Payments to suppliers | (1,451,170) | (1,585,452) | (1,560,030) | (1,590,750) |
| Payments to employees | (110,192) | (117,155) | (120,322) | (123,262) |
| Goods & services tax (net) | 600 | 600 | 600 | 600 |
| Net cash from operating activities | 468,285 | 521,233 | 367,968 | 505,020 |
| Cash flows from investing activities | ||||
| Receipts from sale of state highway held properties | 65,000 | 70,000 | 67,000 | 77,000 |
| Purchase of property, plant and equipment | (3,925) | (2,880) | (6,450) | (3,520) |
| Purchase of intangible assets | (7,133) | (7,720) | (7,000) | (7,000) |
| State highway network | (1,166,628) | (1,623,983) | (1,327,517) | (1,545,900) |
| Loan to local authority | (45) | 0 | 0 | 0 |
| Net cash from investing activities | (1,112,731) | (1,564,583) | (1,273,967) | (1,479,420) |
| Cash flows from financing activities | ||||
| Capital contribution (Crash analysis system) | 408 | 0 | 0 | 0 |
| Capital contribution from the National Land Transport Fund | 650,323 | 758,600 | 1,022,240 | 1,026,674 |
| Capital contribution for the National War Memorial Park | 20,000 | 20,000 | 10,000 | 0 |
| Receipts from borrowing | 170,000 | 370,000 | 197,000 | 190,000 |
| Repayment of borrowing | (200,000) | (100,000) | (320,000) | (240,000) |
| Interest paid on borrowing | (4,550) | (5,200) | (3,240) | (2,275) |
| Net cash from financing activities | 636,181 | 1,043,400 | 906,000 | 974,399 |
| Net (decrease)/increase cash and cash equivalents | (8,265) | 50 | 0 | 0 |
| Cash and cash equivalents at the beginning of the year | 58,265 | 50,000 | 50,050 | 50,050 |
| Cash and cash equivalents at the end of the year | 50,000 | 50,050 | 50,050 | 50,050 |
The GST (net) component of operating activities reflects the net GST paid and received with the Inland Revenue Department. The GST (net) component has been presented on a net basis, as the gross amounts do not provide meaningful information for financial statement purposes and to be consistent with the presentation basis of the other primary financial statements.
Use of information contained in these prospective financial statements
These prospective financial statements have been prepared in accordance with the Crown Entities Act 2004, for the purpose of providing information on the NZ Transport Agency’s future operating intentions and financial position, against which it must report and be formally audited at the end of the financial year.
The information in these financial statements may not be appropriate for purposes other than those described.
The NZ Transport Agency has complied with financial reporting standard FRS 42 Prospective Financial Statements in the preparation of these prospective financial statements.
These prospective financial statements are based on significant financial assumptions as to future events that the NZ Transport Agency reasonably expects to occur at the time this information was prepared. Any changes to these assumptions during the year will not be reflected in these financial statements.
The reader of this report should note that no actual operating results are contained in these prospective financial statements. Actual results achieved for the forecast periods are likely to vary from the information presented, and that some variations may be material.
The NZ Transport Agency does not intend to update the prospective financial statements subsequent to the publication of these statements.
Statement of significant underlying assumptions
The NZ Transport Agency has made a number of assumptions in preparing the prospective financial statements. The most significant of these are outlined below.
| Revenue from the National Land Transport Fund | Revenue forecasts for fuel excise duty, road user charges and motor vehicle registrations are based on future performance and trends. |
| Fees and charges | Forecast revenues are influenced by transaction volumes. Assumptions are based on historical performance and trends. |
| Interest income | Interest income on cash holdings is calculated at 3 percent. This income declines as the current levels of cash holdings is used. |
| Personnel costs | The forecast costs assume the current organisational structure will be in place throughout the period. Remuneration increases are expected to be minimal, with any increases being absorbed through operating efficiencies. |
| Expenditure | The forecast costs assume the current range of activities will be in place throughout the period, and reflect the increasing pressures associated with delivering its programmes and services. |
| Capital | The NZTA is undertaking a programme of capital spending aimed at improving and renewing the state highway network. Projected costs and timing of expenditure are based on project plans and quotations current when these forecasts were prepared. |
| Asset revaluations | The state highway network is re-valued annually. These valuations are dependant on changes in the value of the land, properties and asset components of the state highway network. |
| Opening equity | Estimated opening equity assumes a 2012/13 year surplus of $300.095m. This impacts on estimated amounts of cash on hand and net assets. |
Estimates of appropriations for the year ending 30 June 2014
This table shows the funding the NZTA receives from the government as disclosed in the Estimates of appropriations, and the movements to the revenue published in the Statement of intent.
| Output class | Appropriations 2013/14 $000 |
Funding movements $000 |
SOI 2013/14 $000 |
|---|---|---|---|
| Management of the funding allocation system PLA | 30,000 | 0 | 30,000 |
| Transport planning PLA | 16,400 | (410) | 15,990 |
| Sector research PLA | 5,000 | 600 | 5,600 |
| Public transport PLA | 311,000 | 5,000 | 316,000 |
| Road safety promotion PLA | 33,200 | (1,100) | 32,100 |
| New and improved infrastructure for local roads PLA | 170,000 | (10,000) | 160,000 |
| Renewal of local roads PLA | 246,000 | 0 | 246,000 |
| Maintenance and operation of local roads PLA | 289,000 | 0 | 289,000 |
| Walking and cycling PLA | 20,000 | 0 | 20,000 |
| State highway renewals PLA | 417,000 | 0 | 417,000 |
| Maintenance and operation of state highways PLA | 330,000 | (18,000) | 312,000 |
| National Land Transport Programme PLA | 1,867,600 | (23,910) | 1,843,690 |
| NLTP – new infrastructure for and renewal of state highways | 761,010 | (2,410) | 758,600 |
| Management of the funding allocation system (crash analysis) | 775 | 0 | 775 |
| Licensing and regulatory compliance | 4,031 | (132) | 3,899 |
| Road user charges collection | 13,773 | (3,456) | 10,317 |
| Road user charges investigation and enforcement | 6,279 | 0 | 6,279 |
| Road user charges refunds | 450 | 0 | 450 |
| Refund of fuel excise duty | 429 | 0 | 429 |
| Enhanced public transport concessions for SuperGold cardholders | 23,905 | 0 | 23,905 |
| Administration of the SuperGold cardholders scheme | 95 | 0 | 95 |
| Construction of passing opportunities on SH2 | 3,000 | 500 | 3,500 |
| National War Memorial Park | 25,000 | (5,000) | 20,000 |
| Reinstatement of local roads in Canterbury | 0 | 40,694 | 40,694 |
| Total | 2,706,347 | 6,286 | 2,712,633 |
(PLA – Permanent legislative authority).
The increase in funding is the net result of planned underspends and the carry-forward of funding for reinstatement of local roads in Canterbury.
Reporting entity
The NZ Transport Agency is a Crown entity as defined by the Crown Entities Act 2004 and is domiciled in New Zealand. As such, the NZ Transport Agency’s ultimate parent is the New Zealand Crown.
The NZ Transport Agency’s primary objective is to provide services to the NZ public, as opposed to making a financial return. Accordingly, the NZ Transport Agency has designated itself a public benefit entity for the purposes of New Zealand equivalents to international financial reporting standards (NZ IFRS).
The financial statements for the NZ Transport Agency group are for the period 2013–16, and were approved by the Board on 19 June 2013.
Consolidation of subsidiary
The consolidated financial statements include the parent NZ Transport Agency and its subsidiary NZ Transport Ticketing Limited.
The subsidiary is accounted for using the purchase method, which involves adding together corresponding assets, liabilities, revenues and expenses on a line-by-line basis. All inter-company transactions are eliminated on consolidation.
Consistent accounting policies are applied to the subsidiary’s financial statements and are prepared for the same reporting period as the parent entity.
The NZ Transport Agency’s investment in its subsidiary is carried at cost in the NZ Transport Agency’s own ‘parent entity’ financial statements.
Basis of preparation
Statement of compliance
The financial statements of the NZ Transport Agency have been prepared in accordance with the requirements of the Crown Entities Act 2004, which includes the requirement to comply with generally accepted accounting practice in New Zealand (NZ GAAP).
These financial statements have been prepared in accordance with NZ GAAP as appropriate for public benefit entities and they comply with NZ IFRS.
Measurement base
The financial statements have been prepared on a historical cost basis, except where modified by the revaluation of the state highway network and Bailey bridging stock. The measurement of financial assets and financial liabilities is at amortised cost.
The preparation of financial statements in conformity with NZ IFRS requires the use of certain critical accounting estimates. It also requires management to exercise its judgement in the process of applying the accounting policies. The areas involving a higher degree of judgement or complexity, or areas where assumptions and estimates are significant will be disclosed by way of separate notes to the financial statements.
Functional and presentation currency
The financial statements are presented in New Zealand dollars and all values are rounded to the nearest thousand dollars ($000). The functional currency of the NZ Transport Agency is New Zealand dollars.
Standards, amendments and interpretations issued that are not yet effective and have not been early adopted
The NZ Transport Agency has adopted all standards, amendments and interpretations to existing standards that have been published and are mandatory for its accounting periods beginning on or after 1 July 2013.
Revenue
Revenue is measured at the fair value of the consideration received or receivable.
Revenue from the Crown and the National Land Transport Fund
The NZ Transport Agency is primarily funded through revenue received from the Crown and the National Land Transport Fund, which is restricted in its use for the purpose of the NZ Transport Agency meeting its objectives as specified in the Statement of Intent.
Revenue from the Crown and the National Land Transport Fund is recognised as revenue when earned and is reported in the financial period to which it relates.
Interest
Interest income is recognised using the effective interest method. Interest income on an impaired financial asset is recognised using the original effective interest rate.
Rental income
Lease receipts are recognised as revenue on a straight-line basis over the lease term.
Borrowing costs
The NZ Transport Agency has elected to defer adoption of the revised NZ IAS 23 Borrowing Costs (Revised 2007) in accordance with the transitional provisions of NZ IAS 23 that are applicable to public benefit entities. Consequently, all borrowing costs are recognised as an expense in the financial year in which they are incurred.
Leases
An operating lease is a lease that does not transfer substantially all the risks and rewards incidental to ownership of an asset. Lease payments under an operating lease are recognised as an expense on a straight-line basis over the lease term.
Cash and cash equivalents
Cash and cash equivalents includes cash on hand, deposits held at call with banks, other short-term highly liquid investments with original maturities of three months or less.
Debtors and other receivables
Short-term debtors and other receivables are recognised initially at fair value, less any provision for impairment.
Impairment of a receivable is established when there is objective evidence that the NZ Transport Agency will not be able to collect amounts due according to the original terms of the receivable. Significant financial difficulties of the debtor, probability that the debtor will enter into bankruptcy, receivership or liquidation, and default in payments are considered indicators that the debt is impaired. The amount of the impairment is the difference between the asset’s carrying amount and the present value of estimated future cash flows, discounted using the original effective interest rate. The carrying amount of the asset is reduced through the use of an allowance account, and the amount of the loss is recognised in the surplus or deficit. When the receivable is uncollectible, it is written off against the allowance account for receivables. Overdue receivables that have been renegotiated are reclassified as current (that is, not past due).
Property assets held for sale
Property assets held for sale are classified as held for sale if their carrying amount will be recovered principally through a sale transaction rather than through continuing use. Property assets held for sale are measured at the lower of their carrying amount and fair value less costs to sell.
Any impairment losses for write-downs of property assets held for sale are recognised in the surplus or deficit.
Any increases in fair value (less costs to sell) are recognised up to the level of any impairment losses that have been previously recognised.
Property assets held for sale (including those that are part of a disposal group) are not depreciated or amortised while they are classified as held for sale.
Property, plant and equipment
Property, plant and equipment consist of the following asset classes: leasehold improvements, furniture and fittings, plant and office equipment, and motor vehicles.
Property, plant and equipment are measured at cost or valuation, less any accumulated depreciation and impairment losses.
Additions
The cost of an item of property, plant and equipment is recognised as an asset only when it is probable that future economic benefits or service potential associated with the item will flow to the NZ Transport Agency and the cost of the item can be measured reliably.
Work in progress is recognised at cost less impairment and is not depreciated.
In most instances, an item of property, plant, and equipment is initially recognised at its cost. Where an asset is acquired at no cost, or for a nominal cost, it is recognised at its fair value as at the date of acquisition.
Disposals
Gains and losses on disposals are determined by comparing the proceeds with the carrying amount of the asset. Gains and losses on disposals are reported net in the surplus or deficit. When revalued assets are sold, the amounts included in revaluation reserves in respect of those assets are transferred to general funds.
Subsequent costs
Costs incurred subsequent to initial acquisition are capitalised only when it is probable that future economic benefits or service potential associated with the item will flow to the NZ Transport Agency and the cost of the item can be measured reliably.
The costs of day-to-day servicing of property, plant and equipment are recognised in the surplus or deficit as they are incurred.
Valuation of state highways and Bailey bridging
State highways are valued at depreciated replacement cost based on the estimated present cost of constructing the existing assets by the most appropriate method of construction, reduced by factors for the age and condition of the asset. Land associated with the state highway is valued using an opportunity cost based on adjacent use, as an approximation to fair value. Borrowing costs have not been capitalised.
Bailey bridging is valued at optimised depreciated replacement cost based on the optimum size of asset holding by the unit cost for each category of asset.
A cyclical basis is now being used so that each region is revalued at an interval not exceeding 3.5 years. Those regions that are not subject to full revaluation in a particular year will be subject to a valuation update through the use of price indices.
Increases in the carrying amount arising on revaluation of the state highway are credited to the asset revaluation reserve. Decreases that offset previous increases of the same asset are charged against the asset revaluation reserve. All other decreases are charged to the statement of comprehensive income. Each year the depreciation, based on the revalued carrying amount of the asset, is charged to the statement of comprehensive income. The gain or loss on the asset revaluation reserve is also charged to the statement of comprehensive income.
Subsequent costs are included in the asset’s carrying amount or recognised as a separate asset, as appropriate, only when it is probable that future economic benefits associated with the item will flow to the NZ Transport Agency and the cost of the item can be measured reliably. All other repairs and maintenance are charged to the statement of comprehensive income during the financial period in which they are incurred.
Gains and losses on disposals are determined by comparing the proceeds with the carrying amount of the asset. Gains and losses on disposals are included in the statement of comprehensive income. When revalued assets are sold, the amounts included in the assets revaluation reserve in respect of those assets are transferred to general funds.
Land, held properties, formation and the sub-base component of pavement (base) are not depreciated as the service potential of these components is considered not to reduce over time.
Brownfield costs have been accounted for where they can be reliably measured.
Depreciation
Depreciation is provided on a straight-line basis on all property, plant and equipment other than land, held properties, formation and the subbase component of pavement (base), at rates that will write off the cost (or valuation) of the assets to their estimated residual values over their useful lives. The useful lives and associated depreciation rates of major classes of assets have been estimated as follows:
| Assets | Useful life (years) |
Depreciation rate (%) |
|---|---|---|
| State highways – pavement (base) | 50 | 2.0 |
| State highways – pavement (surface) | 7 | 14.3 |
| State highways – drainage | 60 | 1.7 |
| State highways – traffic facilities | 15 | 6.7 |
| State highways – bridges | 90–100 | 1.0–1.1 |
| State highways – culverts & subways | 50–75 | 1.3–2.0 |
| State highways – other structures | 100 | 1.0 |
| Bailey bridging – panels | 70 | 1.42 |
| Bailey bridging – transoms | 103 | 0.57 |
| Bailey bridging – stringers | 100 | 0.67 |
| Bailey bridging – chord reinforcing | 69 | 1.45 |
| Bailey bridging – other miscellaneous | 76 | 1.0 |
| Motor vehicles | 4 | 25.0 |
| Computer equipment | 3 | 33.3 |
| Plant | 5–10 | 10.0–20.0 |
| Equipment | 5–8 | 12.5–20.0 |
| Furniture & fittings | 5–10 | 10.0–20.0 |
| Office equipment | 4–5 | 20.0–25.0 |
| Leasehold improvements | Life of lease | 7.7–33.0 |
Intangible assets
Software acquisition and development
Acquired computer software licenses are capitalised on the basis of the costs incurred to acquire and bring to use the specific software.
Costs that are directly associated with the development of software for internal use are recognised as an intangible asset. Direct costs include software development employee costs and an appropriate portion of relevant overheads.
Staff training costs are recognised as an expense when incurred.
Costs associated with maintaining computer software are recognised as an expense when incurred.
Costs associated with development and maintenance of the NZ Transport Agency’s website are recognised as an expense when incurred.
Amortisation
The carrying value of an intangible asset with a finite life is amortised on a straight-line basis over its useful life. Amortisation begins when the asset is available for use and ceases at the date that the asset is derecognised. The amortisation charge for each period is recognised in the surplus or deficit.
The useful lives and associated amortisation rates of major classes of intangible assets have been estimated as follows:
| Assets | Useful life (years) |
Depreciation rate (%) |
|---|---|---|
| Computer software | 3–10 | 10–33.3 |
Impairment of property, plant and equipment and intangible assets
Assets that have an indefinite useful life, such as land, are not subject to amortisation and are tested on a cyclical basis so that each region is reviewed at an interval not exceeding three and a half years for impairment.
Assets that are subject to amortisation are reviewed for impairment whenever events or changes in circumstances indicate that the carrying amount may not be recoverable. An impairment loss is recognised for the amount by which the asset’s carrying amount exceeds its recoverable amount. The recoverable amount is the higher of an asset’s fair value less costs to sell and value in use.
Value in use is depreciated replacement cost for an asset where the future economic benefits or service potential of the asset are not primarily dependent on the asset’s ability to generate net cash inflows and where the NZ Transport Agency would, if deprived of the asset, replace its remaining future economic benefits or service potential.
If an asset’s carrying amount exceeds its recoverable amount, the asset is impaired and the carrying amount is written down to the recoverable amount. For re-valued assets, the impairment loss is recognised in other comprehensive income to the extent that the impairment loss does not exceed the amount in the revaluation reserve in equity for the class of asset. Where that results in a debit balance in the revaluation reserve, the balance is recognised in the surplus or deficit.
For assets not carried at a re-valued amount, the total impairment loss is recognised in the surplus or deficit.
The reversal of an impairment loss on a re-valued asset is credited to the other comprehensive income and increases the asset revaluation reserve for that class of asset. However, to the extent that an impairment loss for that class of asset was previously recognised in the surplus or deficit, a reversal of the impairment loss is also recognised in the surplus or deficit.
For assets not carried at a re-valued amount, the reversal of an impairment loss is recognised in the surplus or deficit.
Financial assets
Financial assets are classified as loans and receivables.
Loans and receivables are non-derivative financial assets with fixed or determinable payments that are not quoted in an active market. They are included in current assets, except for maturities greater than 12 months after the balance sheet date. These are classified as non-current assets. Loans and receivables are included in debtors and other receivables or cash and cash equivalents in the balance sheet.
Loan to local authority
Loans to local authorities, made at the government bond rate, are initially recognised at present value of their future cash flows, discounted at the current market rate of return for a similar financial instrument. The difference between the face value and present value of the expected future cash flows of the loan is recognised in the statement of comprehensive income.
Creditors and other payables
Short-term creditors and other payables are recorded at their face value.
Borrowing
Borrowing is initially recognised at their fair value plus transaction costs. After initial recognition, all borrowing is measured at amortised cost using the effective interest method.
Employee entitlements
Short-term employee entitlements
Employee benefits that are due to be settled within 12 months after the end of the period in which the employee renders the related service are measured based on accrued entitlements at current rates of pay.
These include salaries and wages accrued up to balance date, annual leave earned to but not yet taken at balance date, and sick leave.
A liability for sick leave is recognised to the extent that absences in the coming year are expected to be greater than the sick leave entitlements earned in the coming year. The amount is calculated based on the unused sick leave entitlement that can be carried forward at balance date, to the extent that it will be used by staff to cover those future absences.
A liability and an expense are recognised for bonuses where there is a contractual obligation or where there is a past practice that has created a constructive obligation.
Long-term employee entitlements
Employee benefits that are due to be settled beyond 12 months after the end of period in which the employee renders the related service, such as long service leave and retirement gratuities, have been calculated on an actuarial basis. The calculations are based on:
Presentation of employee entitlements
Sick leave, annual leave, and vested long service leave are classified as a current liability. Non-vested long service leave and retirement gratuities expected to be settled within 12 months of balance date are classified as a current liability. All other employee entitlements are classified as a non-current liability.
Superannuation schemes
Defined contribution schemes
Obligations for contributions to the Government Superannuation Fund, Kiwisaver, National Superannuation Scheme, and Post Office Pension Fund are accounted for as defined contribution superannuation scheme and are recognised as an expense in the statement of comprehensive income as incurred.
Provisions
A provision is recognised for future expenditure of uncertain amount or timing when there is a present obligation (either legal or constructive) as a result of a past event, it is probable that an outflow of future economic benefits will be required to settle the obligation, and a reliable estimate can be made of the amount of the obligation.
Provisions are measured at the present value of the expenditure expected to be required to settle the obligation using a pre-tax discount rate that reflects current market assessments of the time value of money and the risks specific to the obligation. The increase in the provision due to the passage of time is recognised as an interest expense.
Onerous contracts
A provision for onerous contracts is recognised when the expected benefits to be derived from a contract are lower than the unavoidable cost of meeting the obligations under the contract.
The provision is measured at the present value of the lower of the expected cost of terminating the contract and the expected net cost of continuing with the contract.
Jointly controlled operations
The NZ Transport Agency has interests in jointly controlled operations. These include the Auckland Motorway Alliance and Marlborough Roads. It recognises in its financial statements:
Equity
Equity is measured as the difference between total assets and total liabilities. Equity is disaggregated and classified into the following components:
State highway revaluation reserve
This reserve relates to the revaluation of the state highway network and Bailey bridging to fair value.
Goods and services tax (GST)
All items in the financial statements are presented exclusive of GST, except for receivables and payables, which are presented on a GST inclusive basis. Where GST is not recoverable as input tax then it is recognised as part of the related asset or expense.
The net amount of GST recoverable from, or payable to, the Inland Revenue Department (IRD) is included as part of receivables or payables in the statement of financial position.
The net GST paid to, or received from the Inland Revenue Department, including the GST relating to investing and financing activities, is classified as an operating cash flow in the statement of cash flows.
Commitments and contingencies are disclosed exclusive of GST.
Income tax
The NZ Transport Agency is a public authority and consequently is exempt from the payment of income tax. Accordingly, no provision has been made for income tax.
Budget figures
The budget figures have been prepared in accordance with NZ GAAP, using accounting policies that are consistent with those adopted by the Board in preparing these financial statements.
Cost allocation
The NZ Transport Agency has determined the cost of outputs using the cost allocation system outlined below.
Direct costs are those costs directly attributed to an output. Indirect costs are those costs that cannot be identified in an economically feasible manner, with a specific output.
Direct costs are charged directly to outputs. Indirect costs are charged to outputs based on cost drivers and related activity/usage information. The three types of indirect costs are:
Critical accounting estimates and assumptions
In preparing these financial statements the NZ Transport Agency has made estimates and assumptions concerning the future. These estimates and assumptions may differ from the subsequent actual results. Estimates and assumptions are continually evaluated and are based on historical experience and other factors, including expectations of future events that are believed to be reasonable under the circumstances. The estimates and assumptions that have a significant risk of causing a material adjustment to the carrying amounts of assets and liabilities within the next financial year are discussed below:
Property, plant and equipment useful lives and residual value
At each balance date, the useful lives and residual values of property, plant, and equipment are reviewed. Assessing the appropriateness of useful life and residual value estimates of property, plant, and equipment requires a number of factors to be considered such as the physical condition of the asset, expected period of use of the asset by the NZ Transport Agency, and expected disposal proceeds from the future sale of the asset.
An incorrect estimate of the useful life or residual value will impact the depreciation expense recognised in the surplus or deficit, and carrying amount of the asset in the statement of financial position. The NZ Transport Agency minimises the risk of this estimation uncertainty by:
The NZ Transport Agency has not made significant changes to past assumptions concerning useful lives and residual values.
Critical judgements in applying NZ Transport Agency’s accounting policies
Management has exercised the following critical judgements in applying accounting policies:
State highway network & Bailey bridging
State highways are valued at depreciated replacement cost based on the estimated present cost of constructing the existing assets by the most appropriate method of construction, reduced by factors for the age and condition of the asset. Land associated with the state highway is valued using an opportunity cost based on adjacent use, as an approximation to fair value.
Bailey bridging is valued at optimised depreciated replacement cost based on the optimum size of asset holding by the unit cost for each category of asset.
Critical judgements relate to:
Brownfield construction costs are included in the valuation where they can be reliably measured.
Brownfield construction costs include:
Further work is currently being carried out to determine a reliable measure of brownfield costs not included in the state highway assets.
Leases classification
Determining whether a lease agreement is a finance lease or an operating lease requires judgement as to whether the agreement transfers substantially all the risks and rewards of ownership to the NZ Transport Agency.
Judgement is required on various aspects that include, but are not limited to, the fair value of the leased asset, the economic life of the leased asset, whether or not to include renewal options in the lease term, and determining an appropriate discount rate to calculate the present value of the minimum lease payments. Classification as a finance lease means the asset is recognised in the statement of financial position as property, plant, and equipment, whereas for an operating lease no such asset is recognised.
The NZ Transport Agency has exercised its judgement on the appropriate classification of equipment leases, and has determined a number of lease arrangements are finance leases.
| Projected 2012/13 $000 | Budget 2013/14 $000 | Forecast 2014/15 $000 | Forecast 2015/16 $000 | |
|---|---|---|---|---|
| Management of the funding allocation system | ||||
| Income | ||||
| Revenue from the Crown (crash analysis system) | 775 | 775 | 775 | 775 |
| Revenue from the National Land Transport Fund | 29,000 | 30,000 | 30,000 | 30,600 |
| Total income | 29,775 | 30,775 | 30,775 | 31,375 |
| Expenditure | ||||
| NZ Transport Agency operating activities (crash analysis system) | 775 | 775 | 775 | 775 |
| NZ Transport Agency operating activities (taxi enf./RSC) | 2,038 | 514 | 514 | 514 |
| NZ Transport Agency operating activities | 26,962 | 29,486 | 29,486 | 30,086 |
| Total expenditure | 29,775 | 30,775 | 30,775 | 31,375 |
| Net surplus/(deficit) | 0 | 0 | 0 | 0 |
| Transport planning | ||||
| Income | ||||
| Revenue from the National Land Transport Fund | 14,430 | 15,990 | 15,980 | 17,300 |
| Total income | 14,430 | 15,990 | 15,980 | 17,300 |
| Expenditure | ||||
| NZ Transport Agency operating activities | 5,120 | 4,150 | 4,150 | 6,200 |
| Funding to approved organisations | 9,310 | 11,840 | 11,830 | 11,100 |
| Total expenditure | 14,430 | 15,990 | 15,980 | 17,300 |
| Net surplus/(deficit) | 0 | 0 | 0 | 0 |
| Sector research | ||||
| Income | ||||
| Revenue from the National Land Transport Fund | 4,400 | 5,600 | 5,000 | 5,100 |
| Total income | 4,400 | 5,600 | 5,000 | 5,100 |
| Expenditure | ||||
| NZ Transport Agency operating activities | 4,400 | 5,600 | 5,000 | 5,100 |
| Total expenditure | 4,400 | 5,600 | 5,000 | 5,100 |
| Net surplus/(deficit) | 0 | 0 | 0 | 0 |
| Public transport | ||||
| Income | ||||
| Revenue from the National Land Transport Fund | 299,000 | 316,000 | 310,000 | 342,800 |
| Total income | 299,000 | 316,000 | 310,000 | 342,800 |
| Expenditure | ||||
| NZ Transport Agency operating activities | 2,890 | 2,963 | 2,643 | 2,600 |
| Funding to approved organisations (PT infrastructure) | 42,110 | 33,037 | 31,357 | 38,600 |
| Funding to approved organisations (PT services) | 254,000 | 280,000 | 276,000 | 301,600 |
| Total expenditure | 299,000 | 316,000 | 310,000 | 342,800 |
| Net surplus/(deficit) | 0 | 0 | 0 | 0 |
| Road safety promotion | ||||
| Income | ||||
| Revenue from the National Land Transport Fund | 30,800 | 32,100 | 31,900 | 33,700 |
| Total income | 30,800 | 32,100 | 31,900 | 33,700 |
| Expenditure | ||||
| NZTA operating activities (vehicle impoundment) | 200 | 200 | 200 | 200 |
| NZ Transport Agency operating activities | 18,774 | 21,017 | 20,742 | 18,379 |
| Funding to approved organisations | 11,826 | 10,883 | 10,958 | 15,121 |
| Total expenditure | 30,800 | 32,100 | 31,900 | 33,700 |
| Net surplus/(deficit) | 0 | 0 | 0 | 0 |
| New and improved infrastructure for local roads | ||||
| Income | ||||
| Revenue from the National Land Transport Fund | 150,000 | 160,000 | 165,000 | 191,000 |
| Total income | 150,000 | 160,000 | 165,000 | 191,000 |
| Expenditure | ||||
| Funding to approved organisations | 150,000 | 160,000 | 165,000 | 191,000 |
| Total expenditure | 150,000 | 160,000 | 165,000 | 191,000 |
| Net surplus/(deficit) | 0 | 0 | 0 | 0 |
| Renewal of local roads | ||||
| Income | ||||
| Revenue from the National Land Transport Fund | 212,000 | 246,000 | 246,000 | 262,500 |
| Total income | 212,000 | 246,000 | 246,000 | 262,500 |
| Expenditure | ||||
| Funding to approved organisations | 212,000 | 246,000 | 246,000 | 262,500 |
| Total expenditure | 212,000 | 246,000 | 246,000 | 262,500 |
| Net surplus/(deficit) | 0 | 0 | 0 | 0 |
| Maintenance and operation of local roads | ||||
| Income | ||||
| Revenue from the National Land Transport Fund | 284,000 | 289,000 | 293,000 | 306,000 |
| Total income | 284,000 | 289,000 | 293,000 | 306,000 |
| Expenditure | ||||
| Funding to approved organisations | 284,000 | 289,000 | 293,000 | 306,000 |
| Total expenditure | 284,000 | 289,000 | 293,000 | 306,000 |
| Walking and cycling | ||||
| Income | ||||
| Revenue from the National Land Transport Fund | 12,000 | 20,000 | 20,000 | 20,600 |
| Total income | 12,000 | 20,000 | 20,000 | 20,600 |
| Expenditure | ||||
| Funding to approved organisations | 12,000 | 20,000 | 20,000 | 20,600 |
| Total expenditure | 12,000 | 20,000 | 20,000 | 20,600 |
| Projected 2012/13 $000 | Budget 2013/14 $000 | Forecast 2014/15 $000 | Forecast 2015/16 $000 | |
|---|---|---|---|---|
| Licensing and regulatory compliance | ||||
| Income | ||||
| Revenue from the Crown | 548 | 548 | 548 | 548 |
| Revenue from the Crown (rules development) | 804 | 899 | 899 | 899 |
| Revenue from the Crown (drug and alcohol assessments) | 1,030 | 1,100 | 1,030 | 1,030 |
| Revenue from the Crown (driver licensing stop orders) | 770 | 806 | 75 | 75 |
| Revenue from the Crown (driver test subsidy) | 1,445 | 1,445 | 1,445 | 1,445 |
| Revenue from third parties (fees and charges) | 69,727 | 66,575 | 67,355 | 67,855 |
| Revenue from third parties (other) | 1,647 | 1,600 | 1,034 | 534 |
| Total income | 75,971 | 72,973 | 72,386 | 72,386 |
| Expenditure | ||||
| Ministerial advice and official correspondence | 794 | 548 | 548 | 548 |
| Rules development | 804 | 899 | 909 | 906 |
| Drug and alcohol assessments | 1,030 | 1,100 | 1,030 | 1,030 |
| Fees and charges funded activities | 65,317 | 70,180 | 69,100 | 69,000 |
| Other (including driver licensing stop orders) | 1,738 | 1,907 | 609 | 109 |
| Total expenditure | 69,683 | 74,634 | 72,196 | 71,593 |
| Net surplus/(deficit) | 6,288 | (1,661) | 190 | 793 |
Rules development is funded by contract with the Ministry of Transport.
The projected surplus in 2012/13 is the result of cost reductions implemented to recover previous deficits.
| Projected 2012/13 $000 | Budget 2013/14 $000 | Forecast 2014/15 $000 | Forecast 2015/16 $000 | |
|---|---|---|---|---|
| Road tolling | ||||
| Income | ||||
| Revenue from third parties | 5,753 | 5,696 | 5,735 | 5,735 |
| Total income | 5,753 | 5,696 | 5,735 | 5,735 |
| Expenditure | ||||
| NZ Transport Agency operating activities | 5,971 | 5,763 | 5,763 | 5,763 |
| Total expenditure | 5,971 | 5,763 | 5,763 | 5,763 |
| Net surplus/(deficit) | (218) | (67) | (28) | (28) |
| Road user charges collection, investigation and enforcement | ||||
| Income | ||||
| Revenue from the Crown (RUC collection) | 13,486 | 10,317 | 13,399 | 13,340 |
| Revenue from the Crown (RUC investigation and enforcement) | 3,779 | 6,279 | 3,779 | 3,779 |
| Revenue from the Crown (RUC refund) | 450 | 450 | 450 | 450 |
| Total income | 17,715 | 17,046 | 17,628 | 17,569 |
| Expenditure | ||||
| NZTA operating activities (RUC collection) | 13,486 | 12,817 | 13,399 | 13,340 |
| NZTA operating activities (RUC investigation and enforcement) | 3,779 | 3,779 | 3,779 | 3,779 |
| NZTA operating activities (RUC refund) | 450 | 450 | 450 | 450 |
| Total expenditure | 17,715 | 17,046 | 17,628 | 17,569 |
| Net surplus/(deficit) | 0 | 0 | 0 | 0 |
| Refund of fuel excise duty | ||||
| Income | ||||
| Revenue from the Crown | 429 | 429 | 429 | 429 |
| Total income | 429 | 429 | 429 | 429 |
| Expenditure | ||||
| NZ Transport Agency operating activities | 429 | 429 | 429 | 429 |
| Total expenditure | 429 | 429 | 429 | 429 |
| Net surplus/(deficit) | 0 | 0 | 0 | 0 |
| Projected 2012/13 $000 | Budget 2013/14 $000 | Forecast 2014/15 $000 | Forecast 2015/16 $000 | |
|---|---|---|---|---|
| New and improved infrastructure for state highways | ||||
| Income | ||||
| Capital contribution from the National Land Transport Fund | 462,423 | 536,600 | 795,240 | 800,775 |
| Revenue from the NLTF (renewals) | 412,000 | 417,000 | 422,000 | 427,000 |
| Revenue from the NLTF (rental and interest income) | 23,127 | 20,600 | 19,000 | 17,500 |
| Borrowing (for toll roads) | 0 | 120,000 | 17,000 | 0 |
| Total income | 897,550 | 1,094,200 | 1,253,240 | 1,245,275 |
| Expenditure | ||||
| NZ Transport Agency operating activities | 31,165 | 31,760 | 31,760 | 31,760 |
| NZTA investment in the state highway network | 926,835 | 1,096,240 | 1,215,240 | 1,288,240 |
| NZTA investment in the state highway network (for toll roads) | 0 | 31,000 | 70,000 | 0 |
| Total expenditure | 958,000 | 1,159,000 | 1,317,000 | 1,320,000 |
| Net surplus/(deficit) | (60,450) | (64,800) | (63,760) | (74,725) |
Net deficits are being funded by receipts from the sale of state highway held properties.
| Projected 2012/13 $000 | Budget 2013/14 $000 | Forecast 2014/15 $000 | Forecast 2015/16 $000 | |
|---|---|---|---|---|
| Renewal of state highways | ||||
| Income | ||||
| Capital contribution from the National Land Transport Fund | 187,900 | 222,000 | 227,000 | 225,900 |
| Total income | 187,900 | 222,000 | 227,000 | 225,900 |
| Expenditure | ||||
| NZ Transport Agency operating activities | 8,735 | 8,000 | 8,000 | 8,000 |
| NZTA investment in the state highway network | 179,165 | 214,000 | 219,000 | 217,900 |
| Total expenditure | 187,900 | 222,000 | 227,000 | 225,900 |
| Net surplus/(deficit) | 0 | 0 | 0 | 0 |
| Maintenance and operation of state highways | ||||
| Income | ||||
| Revenue from the National Land Transport Fund | 352,700 | 312,000 | 335,000 | 345,000 |
| Revenue from third parties (business units) | 964 | 944 | 944 | 944 |
| Total income | 353,664 | 312,944 | 335,944 | 345,944 |
| Expenditure | ||||
| NZ Transport Agency operating activities | 8,735 | 13,084 | 15,177 | 16,978 |
| NZ Transport Agency operating activities (business units) | 865 | 865 | 865 | 865 |
| NZTA investment in the state highway network operations | 343,965 | 298,916 | 319,823 | 328,022 |
| Total expenditure | 353,565 | 312,865 | 335,865 | 345,865 |
| Net surplus/(deficit) | 99 | 79 | 79 | 79 |
| Projected 2012/13 $000 | Budget 2013/14 $000 | Forecast 2014/15 $000 | Forecast 2015/16 $000 | |
|---|---|---|---|---|
| Enhanced public transport concessions for supergold cardholders | ||||
| Income | ||||
| Revenue from the Crown | 22,755 | 23,905 | 25,905 | 17,905 |
| Total income | 22,755 | 23,905 | 25,905 | 17,905 |
| Expenditure | ||||
| Funding to approved organisations | 22,755 | 23,905 | 25,905 | 17,905 |
| Total expenditure | 22,755 | 23,905 | 25,905 | 17,905 |
| Net surplus/(deficit) | 0 | 0 | 0 | 0 |
| Administration of the supergold cardholders scheme | ||||
| Income | ||||
| Revenue from the Crown | 95 | 95 | 95 | 95 |
| Total income | 95 | 95 | 95 | 95 |
| Expenditure | ||||
| NZ Transport Agency operating activities | 95 | 95 | 95 | 95 |
| Total expenditure | 95 | 95 | 95 | 95 |
| Net surplus/(deficit) | 0 | 0 | 0 | 0 |
| Construction of passing opportunities on SH2 between Napier and Gisborne | ||||
| Income | ||||
| Revenue from the Crown | 1,500 | 3,500 | 0 | 0 |
| Total income | 1,500 | 3,500 | 0 | 0 |
| Expenditure | ||||
| NZTA investment in the state highway network | 1,500 | 3,500 | 0 | 0 |
| Total expenditure | 1,500 | 3,500 | 0 | 0 |
| Net surplus/(deficit) | 0 | 0 | 0 | 0 |
| National War Memorial Park | ||||
| Income | ||||
| Capital contribution from the Crown | 20,000 | 20,000 | 10,000 | 0 |
| Total income | 20,000 | 20,000 | 10,000 | 0 |
| Expenditure | ||||
| NZTA investment in the state highway network | 20,000 | 20,000 | 10,000 | 0 |
| Total expenditure | 20,000 | 20,000 | 10,000 | 0 |
| Net surplus/(deficit) | 0 | 0 | 0 | 0 |
| Reinstatement of local roads in Canterbury | ||||
| Income | ||||
| Revenue from the Crown | 16,306 | 40,694 | 0 | 0 |
| Total income | 16,306 | 40,694 | 0 | 0 |
| Expenditure | ||||
| Funding to approved organisations | 25,200 | 40,694 | 0 | 0 |
| Total expenditure | 25,200 | 40,694 | 0 | 0 |
| Net surplus/(deficit) | (8,894) | 0 | 0 | 0 |
The projected deficit for 2012/13 is funded by the prior year surplus.
| Previous page | Table of contents | Next page |